Multiple Choice
Use your knowledge base and
problem solving skills to select the correct answer for each question.
|
|
|
1.
|
Political surveys, newspaper polls and Internet surveys are all examples
of:
a. | Clustered sampling. | b. | Voluntary-response
sampling. | c. | Destructive sampling. | d. | Random
sampling. |
|
|
|
2.
|
What is the disadvantage of simple random sampling?
a. | It is difficult to conduct and expensive when surveying a large
population | b. | It is affected by many factors | c. | It requires a lot of
information | d. | It does not represent the population accurately if all subjects
participate |
|
|
|
3.
|
Why is Authority in a web resource important?
a. | Sponsorship (who pays) is not always indicated | b. | It is often hard to
determine a web page’s authorship and if they have any credibility | c. | Anyone can publish
anything on the web | d. | All of the
Above |
|
|
|
4.
|
When evaluating the reliability of a web source of secondary data, which of the
following considerations does not really help you evaluate whether or not to use the secondary
data?
a. | Authority: who or what organization provided it | b. | Verification: you
can find the results elsewhere | c. | Timely: the data is recent | d. | Quantity: there
isn’t too much data to sift through, and it’s organized. |
|
|
|
5.
|
Researchers can use these techniques to eliminate response bias:
a. | Shake the respondents hand firmly before asking them a question. | b. | If the respondent
doesn’t answer the question as you’d like them to, simply ask again. | c. | Guaranteed anonymity
and follow up questions. | d. | Random
sampling. |
|
|
|
6.
|
For response bias to occur what does the respondent have to do?
a. | Attempt to please the questioner | b. | Answer a question with another
question | c. | Hang up the phone | d. | State his or her own
opinions |
|
|
|
7.
|
When is clustered random sampling usually used?
a. | When the geographical area to be surveyed is too large | b. | When the surveyor
wants to leave out a certain group of people | c. | When the geographical area being surveyed is
too small | d. | None of the above |
|
|
|
8.
|
Which graph is the best at showing the relationship between two
variables?
a. | Histogram | b. | Pie graph | c. | XY scatter
plot | d. | Column graph |
|
|
|
9.
|
Response bias occurs when:
a. | A sample is selected simply because it is easily accessible. | b. | Sampling is used to
test a product to its limit. | c. | Participants in a survey give false or
misleading answers. | d. | Individuals are unwilling to participate in the
survey. |
|
|
|
10.
|
Which of the following is an example of clustered random sampling?
a. | Six percent of Calgary’s middle-aged women are surveyed | b. | The entire city of
Toronto is surveyed on a matter pertaining to the GTA only | c. | Ten urban areas are
selected at random in Ontario about power usage, and the number of respondents to be randomly
selected from each city are determined based on the proportion of the province living in each
city | d. | In a national survey, four provinces are randomly selected, then cities from within
those are randomly selected, then people within those cities are randomly selected to be
surveyed |
|
|
|
11.
|
The military rank of personnel falls under what category of data?
a. | Continuous | b. | Nominal | c. | Ordinal | d. | Discrete |
|
|
|
12.
|
Which graph is the most suitable for representing time-series
data?
a. | Pie graph | b. | Histogram | c. | Line
graph | d. | Scatter plot |
|
|
|
13.
|
What best illustrates an example of measurement bias?
a. | You had an open-ended question for age, and some people submitted ridiculous answers
like 1,000 years old | b. | A device was used to clock how fast people were
driving down a residential road, but the device was found to be malfunctioning at the end of the
day | c. | You ask the hours of video gaming university students engage in with the following
scale:
0-2 hours
2-3 hours | d. | They all do |
|
|
|
14.
|
Which of the following biases would result from surveying seniors in a
retirement home?
a. | Response bias | b. | Non-response bias | c. | Sampling
bias | d. | Self-selection bias | e. | Measurement
bias |
|
|
|
15.
|
Which of the following biases would result from surveying seniors about their
sexuality?
a. | Measurement bias | b. | Non-response bias | c. | Sampling
bias | d. | Self-selection bias |
|
|
|
16.
|
Which of the following biases would result from a voluntary sampling
method?
a. | Response bias | b. | Non-response bias | c. | Measurement
bias | d. | Self-selection bias |
|
|
|
17.
|
Which of the following biases would result from a convenience sampling
method?
a. | Response bias | b. | Non-response bias | c. | Measurement
bias | d. | Sampling bias |
|
|
|
18.
|
Bias eliminates which one of the following:
a. | The ability to analyze and calculate statistics from the data you
collect | b. | Your ability to generalize your results to the greater
population | c. | The number of people who will respond to your survey | d. | The overall cost of
the study |
|
|
|
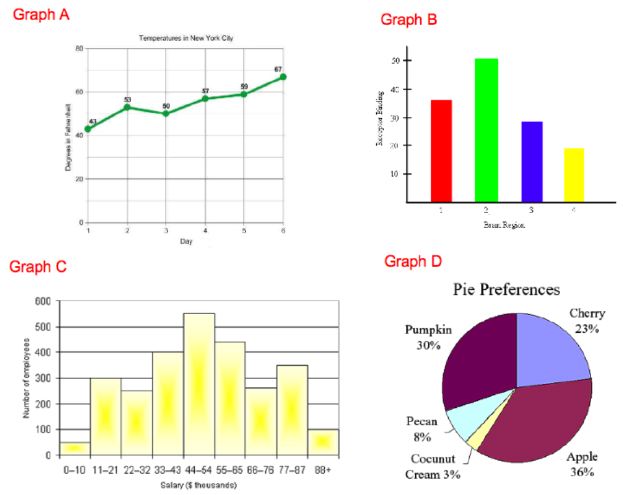
Examine the graphs below and answer the multiple choice
question that follows.
|
|
|
19.
|
Based the images above, which one is a histogram?
a. | Graph A | b. | Graph B | c. | Graph
C | d. | Graph D |
|
|
|
20.
|
Which graph is the best at showing the distribution of a data set of one
variable (e.g. of age)?
a. | Graph A | b. | Graph B | c. | Graph
C | d. | Graph D |
|
Matching
|
|
|
Match the following list of problems with the survey
questions listed below.
a. | This is an example of a loaded
question | b. | This is an example of a double-barreled
question | c. | This is an example of a leading
question | d. | There is nothing wrong with this
question |
|
|
|
1.
|
How old are you?
|
|
|
2.
|
How often do you do you use drugs?
|
|
|
3.
|
For how long do you brush your teeth in the
morning?
|
|
|
4.
|
Most people like to spend time with their family on
holidays. How often do you spend with your on these occasions?
|
|
|
5.
|
How often do you smoke
|
|
|
6.
|
Students generally want to make a difference, do you want
to make a difference?
|
|
|
7.
|
How often do you skip class?
|